
Prove personalization ROI with real data
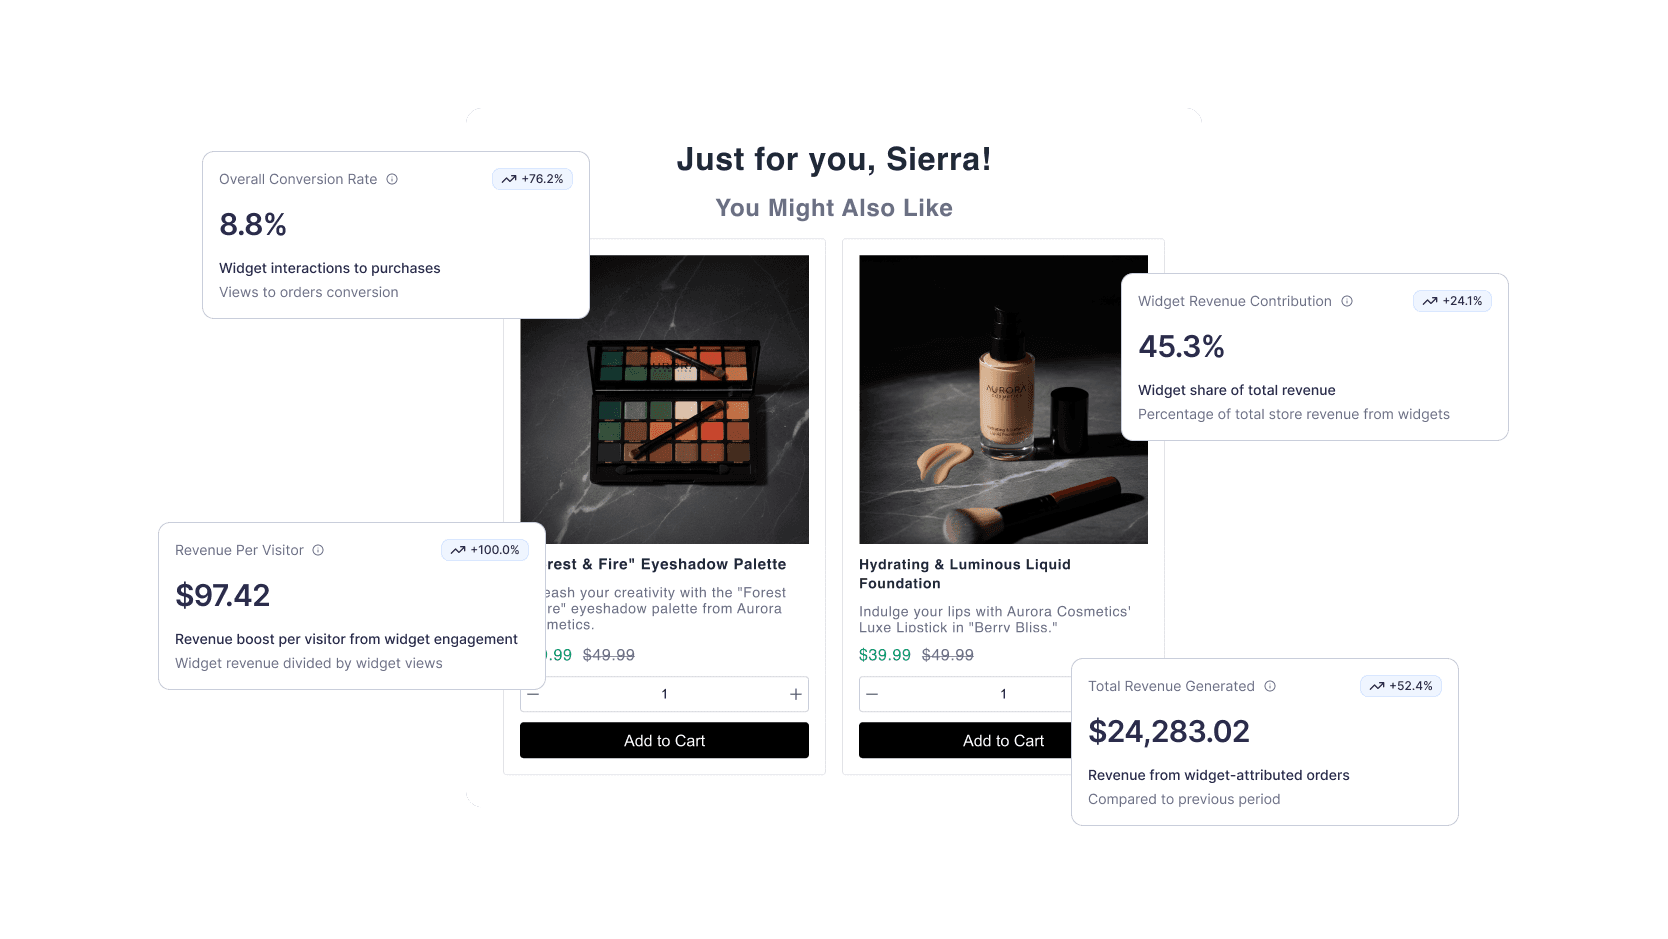
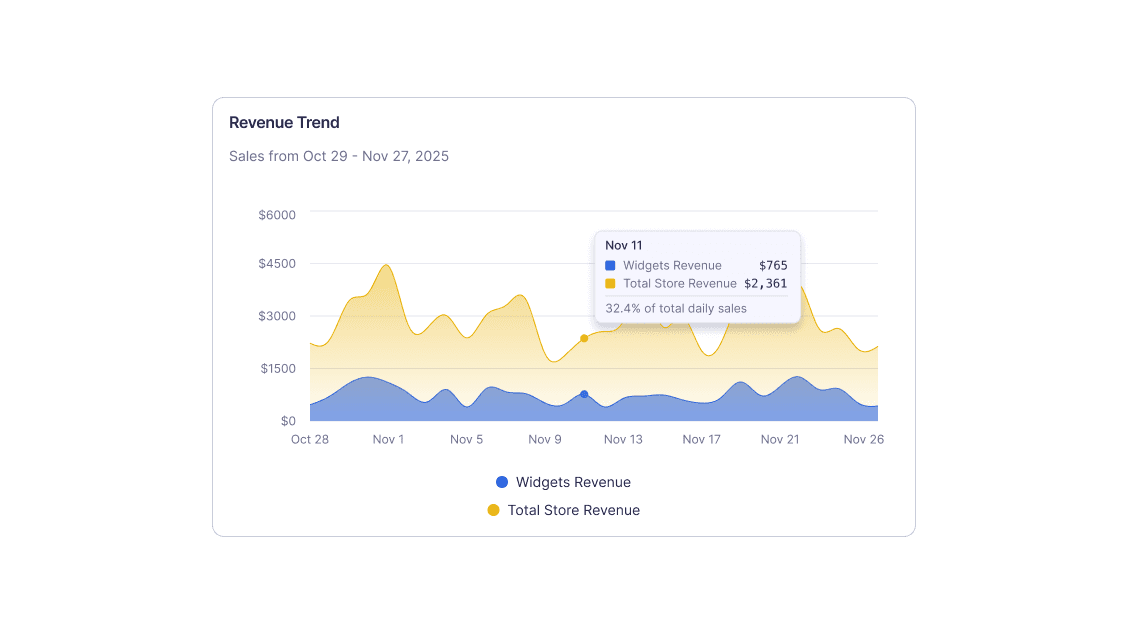
Track exactly how your recommendations drive revenue. See which widgets convert, which products perform, and where to optimize next - all in one dashboard.
Stop guessing, start knowing - measure every dollar your personalization generates
Complete analytics for optimization
Track performance at every level - from individual widgets to overall personalization ROI
Track every widget's impact
Monitor views, clicks, conversions, and revenue for each widget across your store. Compare performance by placement, page type, and device to understand what works where and optimize accordingly.
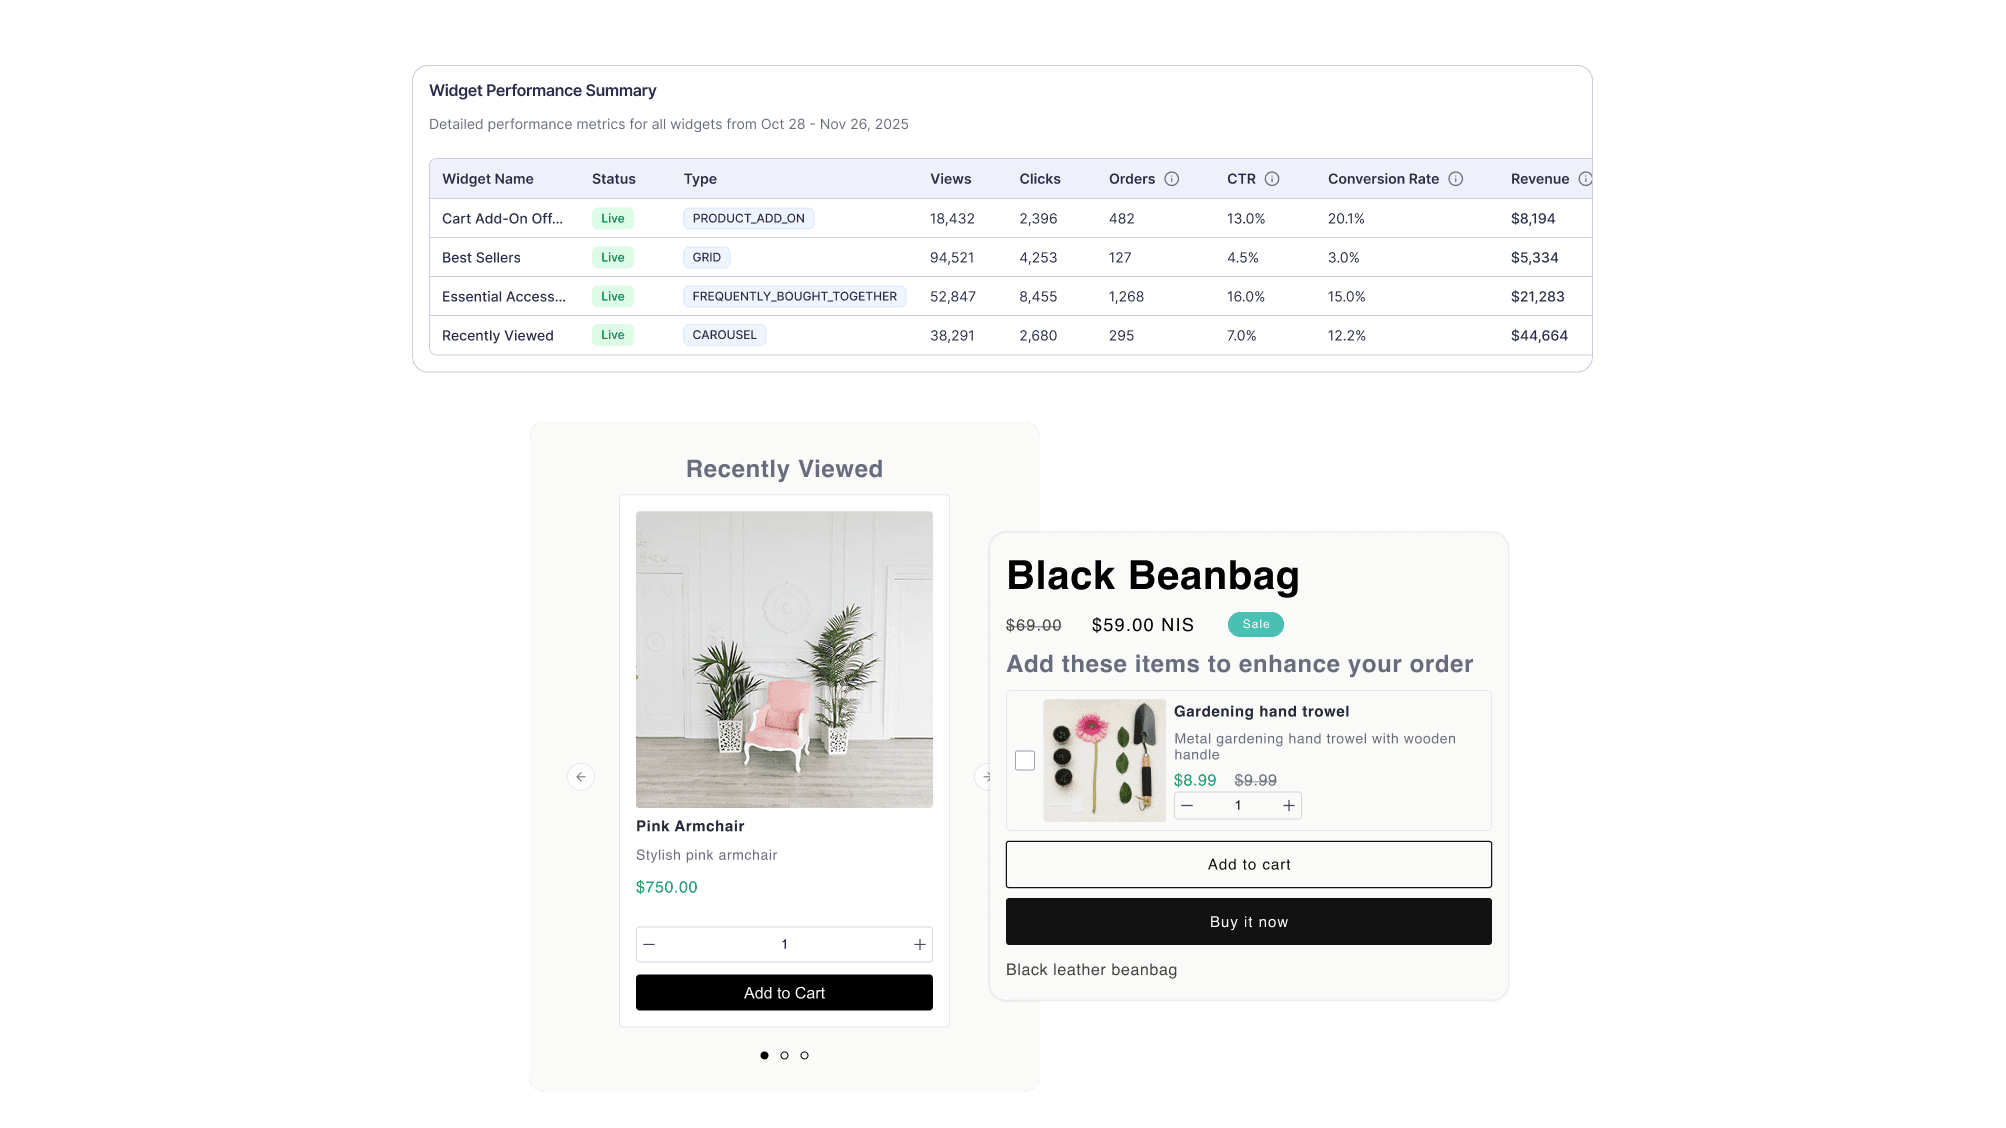
Discover which recommenders convert best
See which recommendation strategies drive the most revenue. Compare Trending Now vs. Frequently Bought Together vs. Personalized for You - then double down on what works for your customers.
Identify your revenue drivers
Discover which products perform best in recommendations and which underperform. Track click-through rates, conversion rates, and revenue per product to optimize your catalog strategy.
Common questions about Analytics
Turn data into revenue growth
Start tracking personalization performance in 5 minutes.